Presence Dashboard
Overview of the Pult Presence Dashboard -- your central place for attendance data and analytics.
The Presence Dashboard is where admins view real-time and historical attendance data for their organization. It combines data from both the Pult Agent and WiFi Presence into a unified view.
Accessing the Dashboard
Navigate to Presence → Dashboard in the Pult admin navigation.
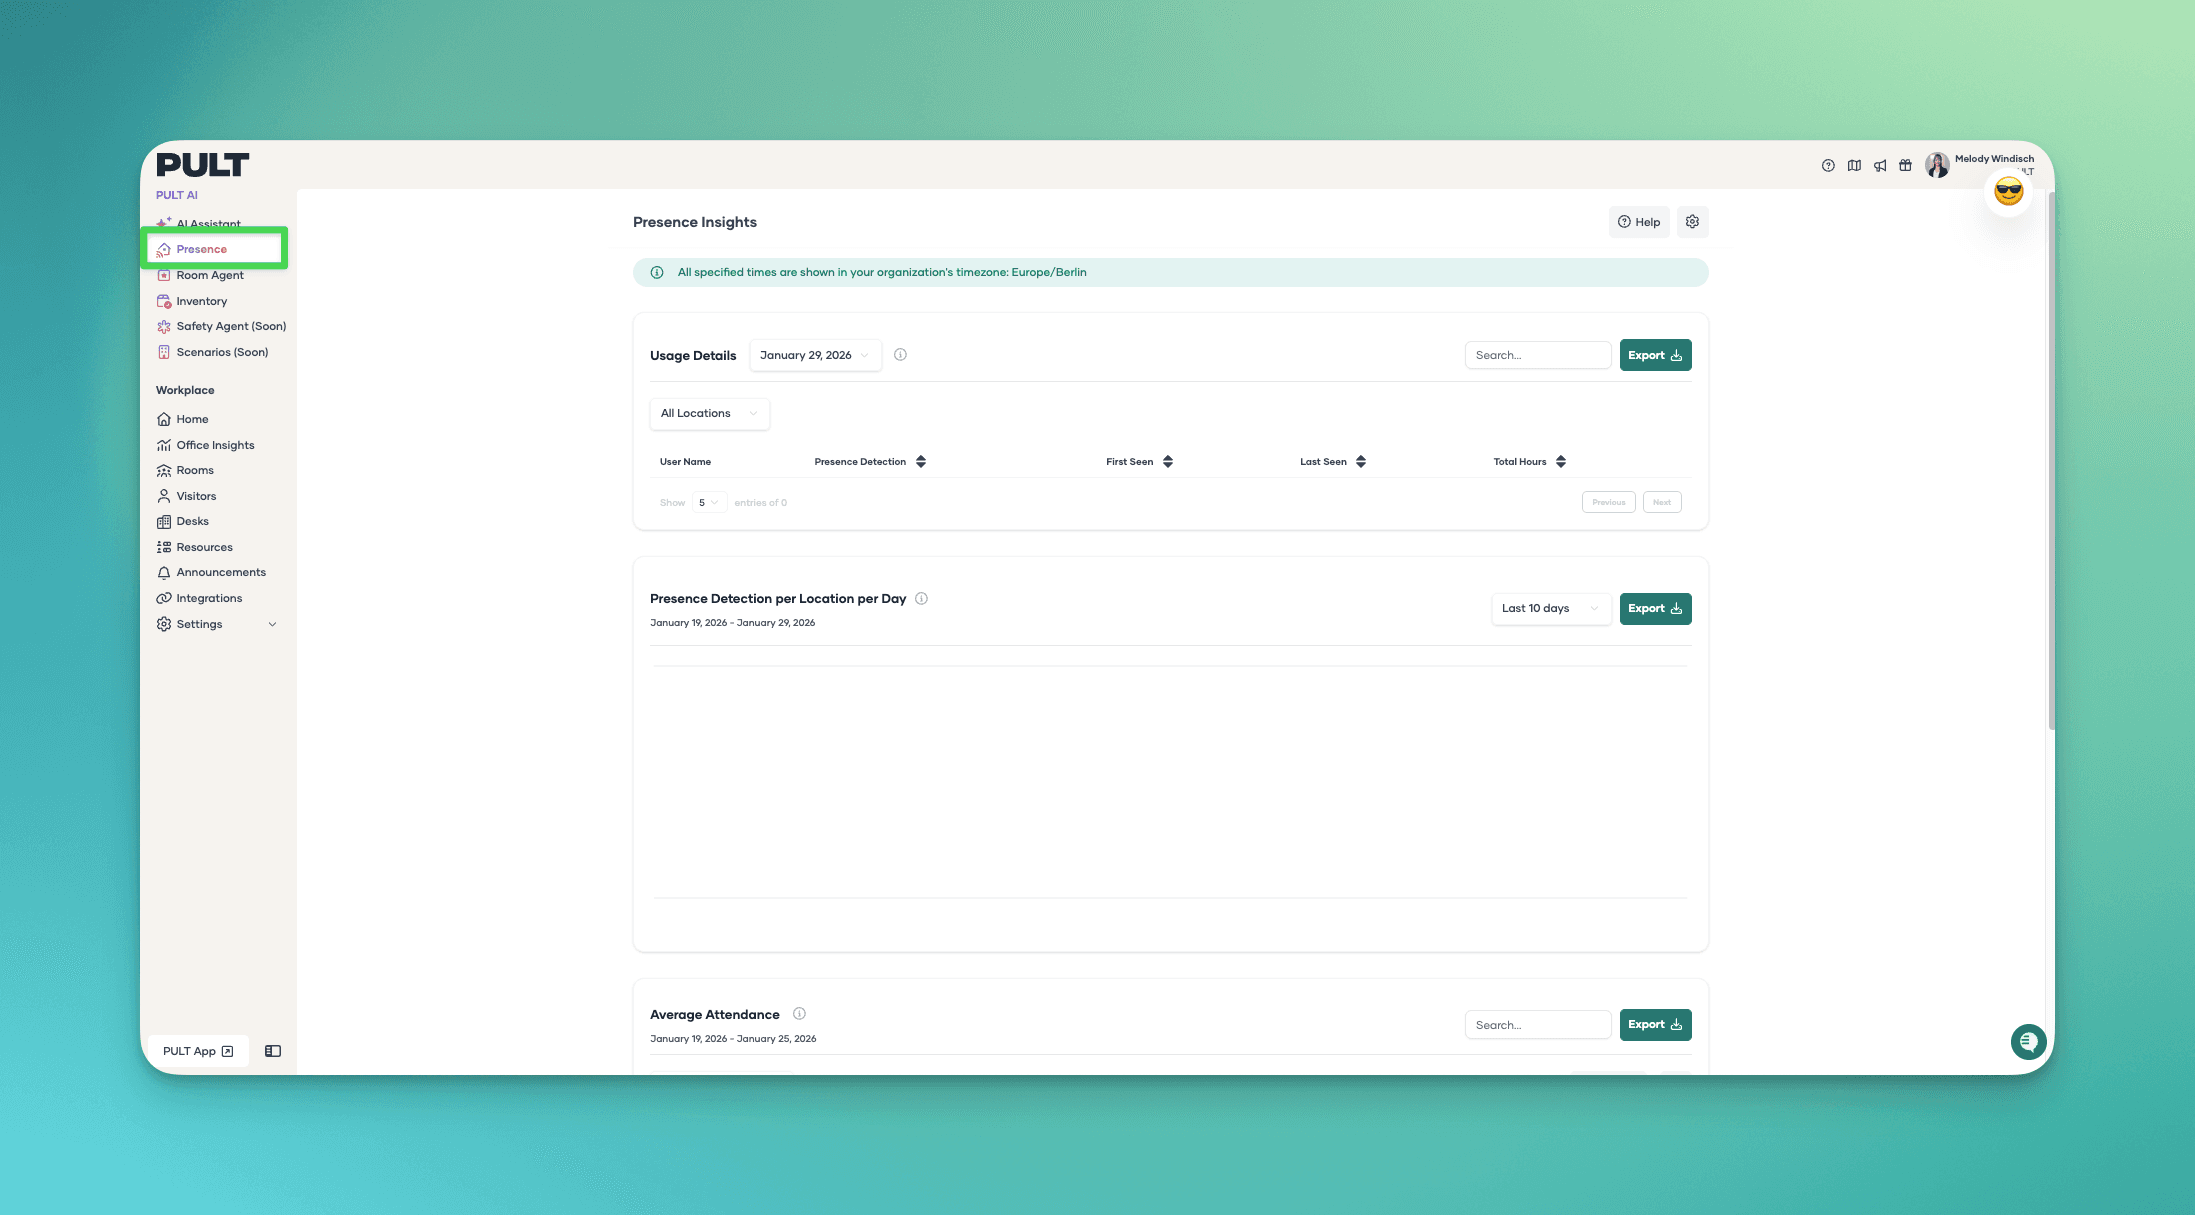
Dashboard Sections
The dashboard is organized into three main sections:
Usage Details
A per-user table showing who was present on a given day, with first and last detection times. Supports date selection, search, team filtering, and CSV export.
Presence by Location
A chart showing the number of detected users per presence location per day over a configurable date range. Exportable as CSV.
Average Attendance
A grid view showing average attendance per user over a time period, with filtering by team, location, and absence exclusions. Exportable as CSV.
Data Sources
The dashboard aggregates presence data from all configured sources:
- Pult Agent beacons (IP-based presence detection)
- WiFi Presence sync (WiFi client activity matched via MDM)
Both sources contribute to the same user-level presence records. A user detected by either method is shown as present.
Next Steps
- Explore the Presence Insights in detail.
- Learn how to export and schedule reports.
Last updated on Apr 20, 2026, 10:32 PM